1. Overview
dashi is a Python library designed to analyze and characterize temporal and multi-source dataset shifts. It provides robust tools for both supervised and unsupervised evaluation of dataset shifts, empowering users to detect, understand, and address changes in data distributions with confidence.
Key Features
- Supervised Characterization: Analyze model performance across temporal or multi-source batches using Random Forests.
- Unsupervised Characterization: Identify latent temporal variability using projections of data distributions onto non-parametric statistical manifolds.
Visualization Tools
- Data Temporal Heatmaps (DTHs): Explore temporal shifts visually.
- Information Geometric Temporal (IGT) Plots: Visualize temporal variability across data batches.
- Multi-batch Contingency Matrices: Compare evaluation metrics across training-test combinations.
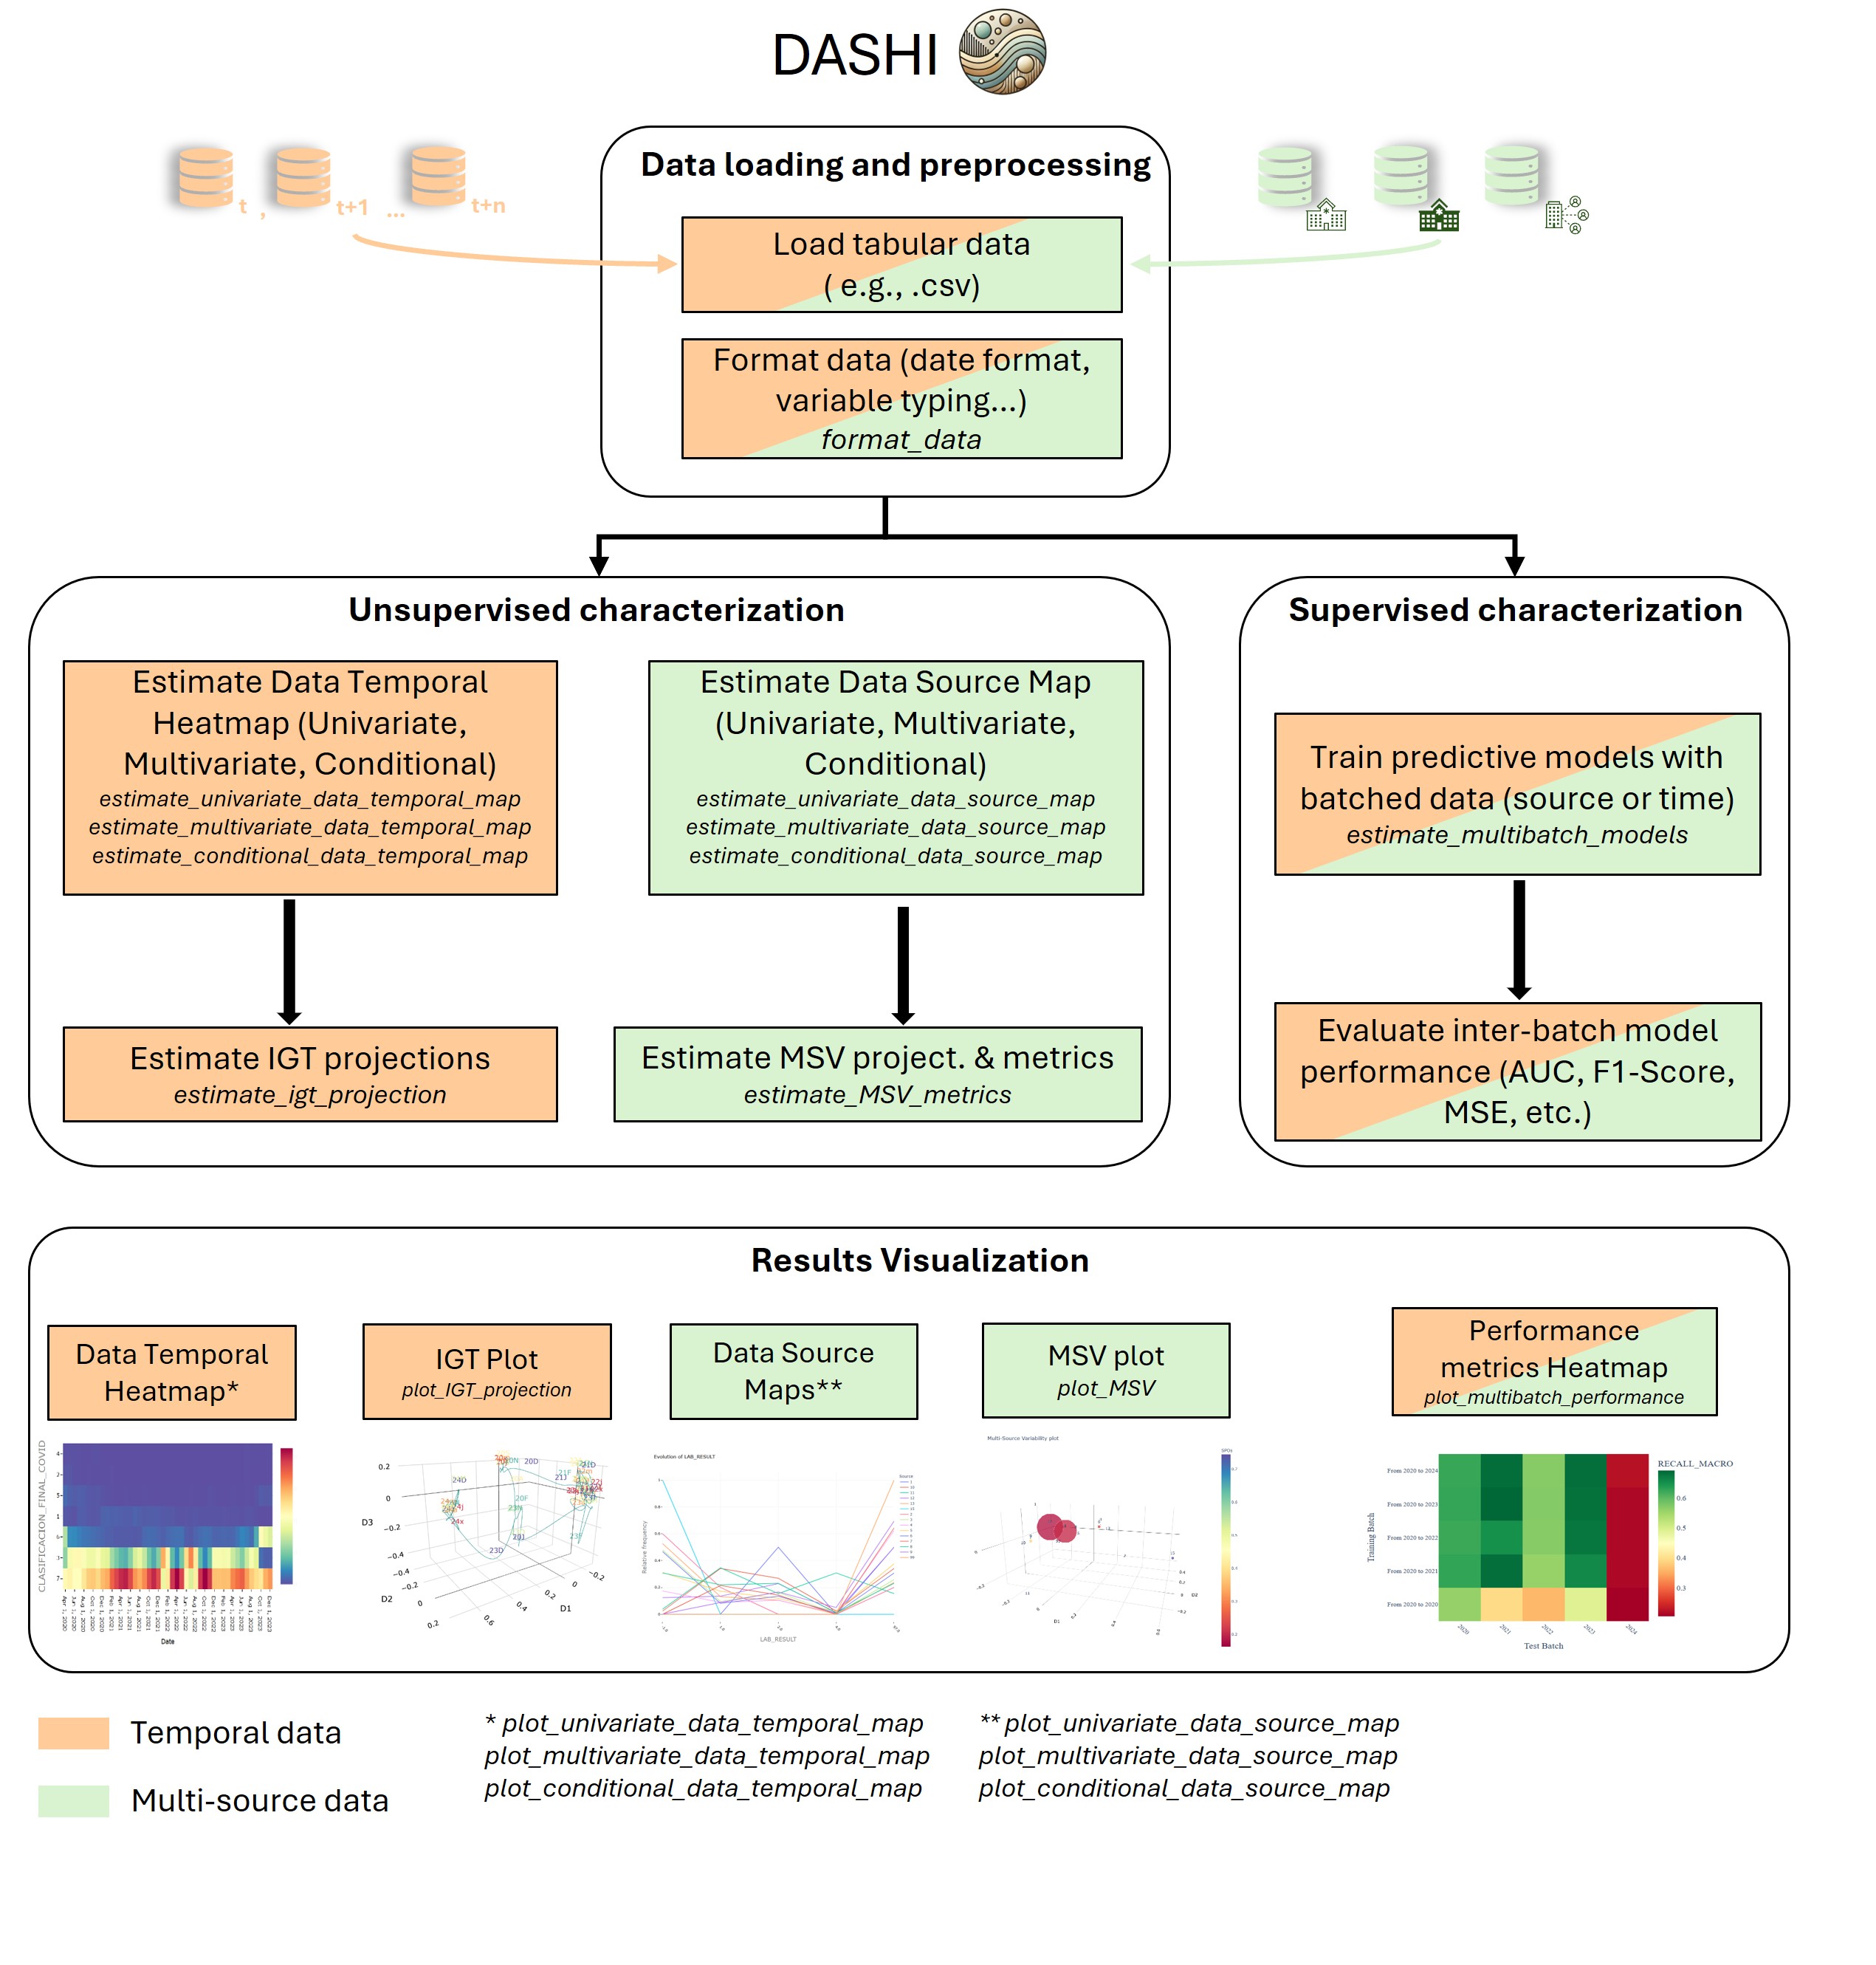
General workflow of the DASHI Python package. Tabular data are loaded and formatted, then characterized in two ways depending on the nature of the data: (i) temporal structure leading to IGT projections, and (ii) source heterogeneity producing MSV projections and metrics. A supervised stage trains multibatch models (by time or source) and evaluates inter-batch performance. Outputs include data temporal maps, IGT plots, data-source maps, MSV plots, and performance-metric heatmaps. IGT = Information-Geometric Temporal; MSV = Multi-Source Variability. Classification metrics: AUC (per-class and macro), accuracy, log-loss, and precision/recall/F1 (per-class and macro/micro/weighted). Regression metrics: MAE, MSE, RMSE, and 𝑅2.
2. Installation
You can install dashi directly from PyPI:
pip install dashiOr install from source:
git clone https://github.com/bdslab-upv/dashi
cd dashi
pip install .
2.1. Requirements
- Python 3.10 or higher
- pip package manager
3. Using the dashi package
A complete usage tutorial is available in the Usage Tutorial or go to the Resources section for more information.
Documentation
Detailed documentation is available at: Documentation Site
Publications
See list of related publications here.